Syndetics is here to help libraries affected by the Baker & Taylor shutdown,
learn more.
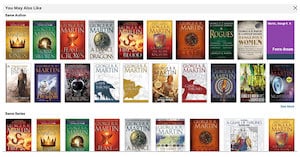
Last year, we queried our customers about what their favorite Syndetics Unbound elements were. Not surprisingly, Recommendations were at the top of that list, but let’s take a deeper look at what you love the most about Syndetics Unbound. Public and Academic Libraries alike rated our You May Also Like recommendations as their favorite element. The recommendations provide the opportunity for serendipitous discovery of new titles and are based on both user suggestions from LibraryThing for Libraries and big data algorithms.

We recently did a blog post on the Top Syndetics Unbound Titles of 2020, covering what public-library patrons were searching for and finding in 2020. But what about academic libraries? This data was aggregated across libraries using Syndetics Unbound worldwide. The picture is more complicated in academic libraries than public libraries. First, academic libraries differ from each other more than public ones do. Titles that head the list month after month at technical colleges may not even appear at a law or divinity library.
Syndetics Unbound is excited and pleased to announce that we have worked with Patron Point, a library marketing automation partner, to offer Patron Point Recommends™ – a new reading recommendation service that helps public libraries market content to their patrons, increasing engagement and usage. Patron Point Recommends automatically creates eye-catching, branded monthly newsletters for new titles from a library’s catalog enriched with LibraryThing recommendations and summaries, and covers from the Syndetics Unbound service.
The Syndetics Unbound team is humbled and excited to announce our Platinum Award in the 2021 Modern Library Awards (MLAs) from LibraryWorks. This is the first time that Syndetics Unbound has been entered for an MLA, and we are thrilled to have been chosen for this award. Jenny Newman, publisher and MLA program manager, said, “It’s hardly a surprise that Syndetics Unbound scored so well. They’ve been at the forefront of the industry since their company entered the market in 2016.

Ever wonder what patrons are searching for in library catalogs? We have the answers for 2020, aggregated from all the public libraries that use Syndetics Unbound. United States Top Fifteen These were the top fifteen most searched-for books of 2020 in US public libraries. Where the Crawdads Sing by Delia Owens American Dirt by Jeanine Cummins Camino Winds by John Grisham The Vanishing Half by Brit Bennett The Silent Patient by Alex Michaelides The Guest List: A Novel by Lucy Foley The Giver of Stars by Jojo Moyes Walk the Wire by David Baldacci Little Fires Everywhere by Celeste Ng 28 Summers by Elin Hilderbrand The Dutch House by Ann Patchett Such a Fun Age by Kiley Reid Educated: A Memoir by Tara Westover Fair Warning by Michael Connelly The Boy from the Woods by Harlan Coben Month by Month The top books above are mostly popular books that stayed popular for much of the year.

This blog provides a historical review of the life of R.R. Bowker, and the dynamic impact and legacy that he’s left on the library world today. By Bob Nardini Today the largest library on the University of Michigan’s Ann Arbor campus is closed to most people due to COVID-19. But one hundred years ago, despite lingering cases of that era’s influenza pandemic, at the building’s opening in 1920 the day was marked with public ceremony.
We’ve looked at a lot of different catalogs and discovery layers over the past few years, and learned a lot about usage statistics (read more about our new usage stats here. Out of that, we thought we’d share some tips about how you can optimize your Syndetics Unbound subscription. Don’t hide the content The more a user has to click, the less they will do so. If Syndetics Unbound is shown within an accordion, behind a tab, or very far down on a detail page, your patrons will see it less, and accordingly, interact with it less.
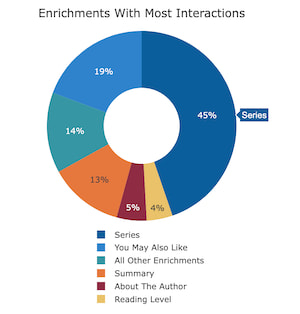
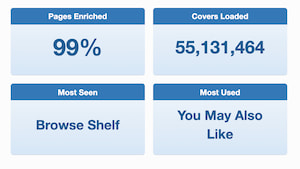
We’re very pleased to announce a major improvement to our Syndetics Unbound statistics page. Our new usage statistics include deep dives into coverage and interaction statistics, many charts and graphs, a date selector tool, and the ability to limit your view by instance. Syndetics Unbound subscribers can check it out in the Syndetics Unbound Admin, under Statistics. Some of the metrics we’re tracking and displaying now include: Coverage charts show the number of times Syndetics Unbound showed any enrichment on a catalog page, and as a percentage of all catalog pages loaded.
Want to increase usage of Syndetics Unbound? Increase its visibility! Many users don’t click beyond the search results page to view the detail record in your catalog. To that end, we’ve added an abbreviated version of Syndetics Unbound that launches small lightboxes for each element, directly from your search results page. We’ve seen usage statistics rise dramatically when libraries enable Syndetics Unbound on search results pages, so give it a try!